Analytical Result
PASS Report
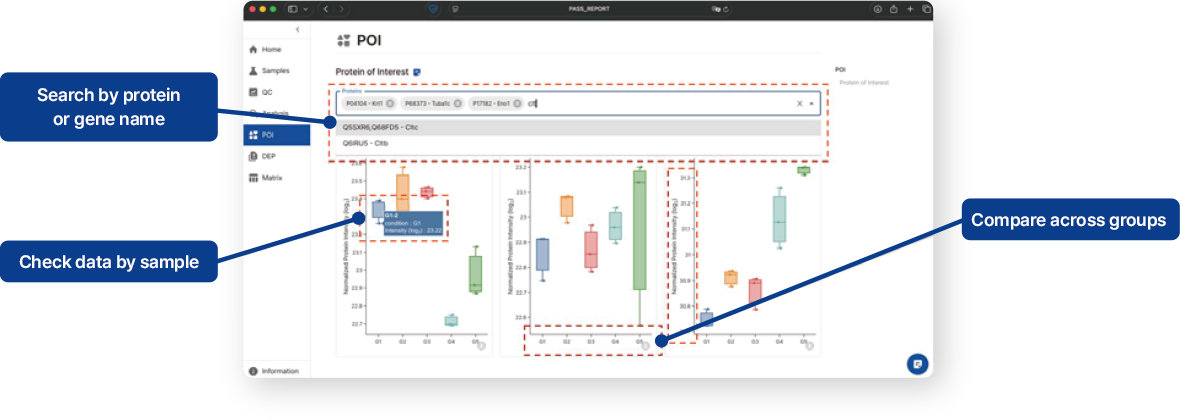
PASS provides an integrated analytical report designed to help researchers intuitively understand complex proteomics results.
PASS Report
PASS provides an integrated analytical report designed to help researchers intuitively understand complex proteomics results.
- Through visualized key indicators of proteomic analysis, researchers can quickly review results and easily identify protein candidates or biological pathways relevant to their study objectives.
- Each result is implemented in an interactive format, allowing users to adjust thresholds or explore specific data directly. Result tables (.csv) and editable figures (.svg) are provided for download, making them highly useful for manuscript preparation or follow-up studies.
- Upon request, customized report formats can be designed through prior consultation.
-
- Integrated
Analytical Report - Delivered as an HTML report, accessible without any additional software installation.
- Integrated
-
- Visualization of
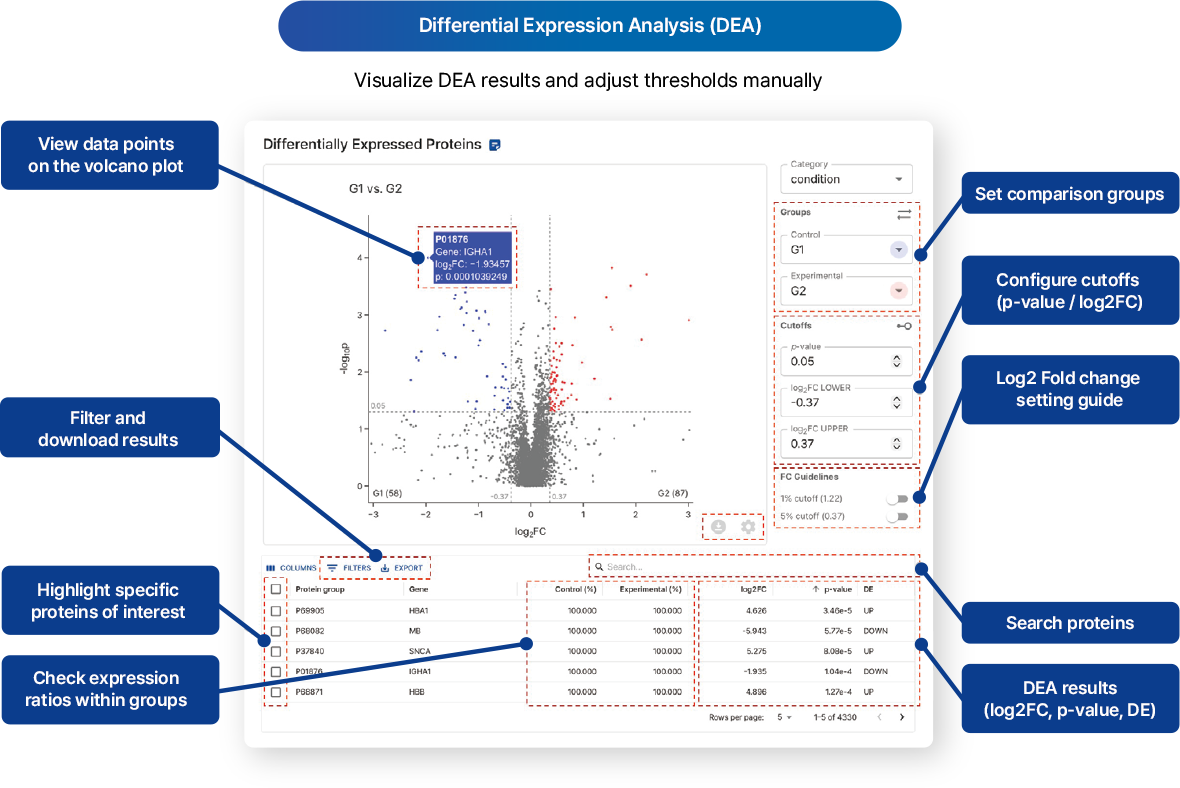
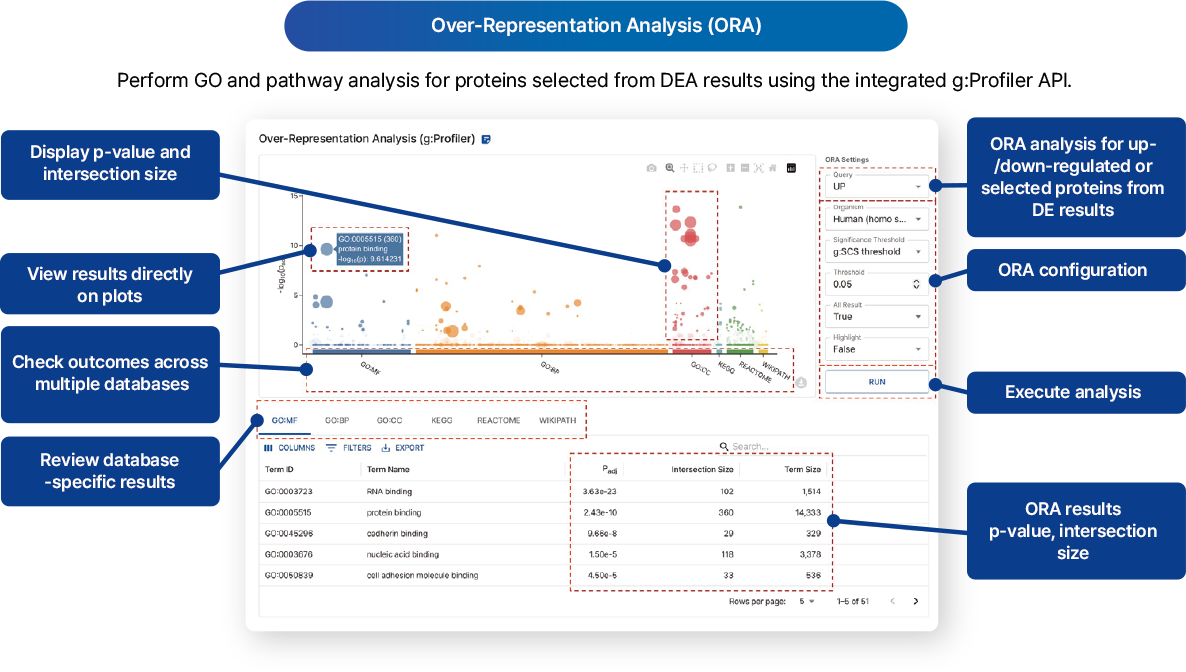
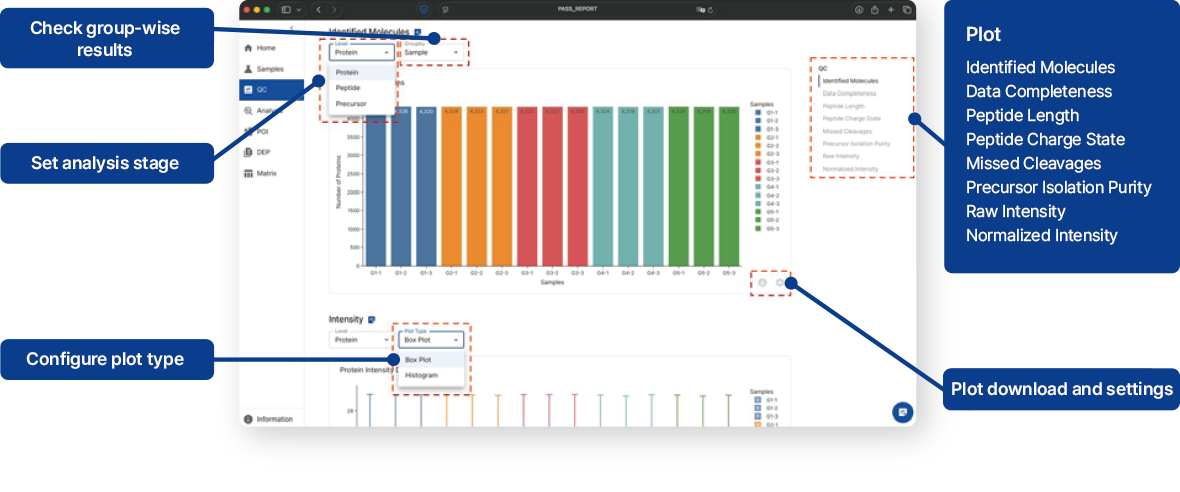
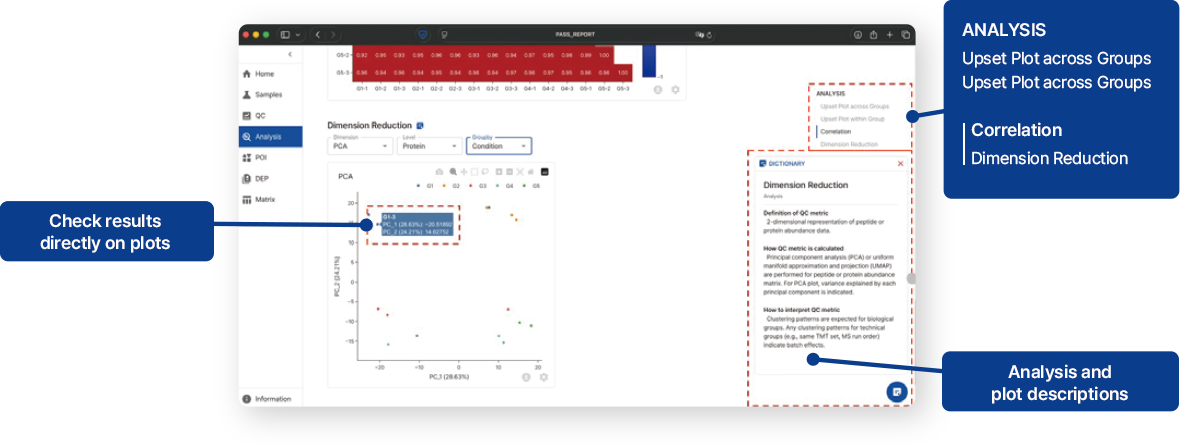
Key Proteomic Indicators - Provides comprehensive visualization of key analysis results such as Data QC, Data Exploration, and Differential Expression Analysis (DEA).
- Visualization of
-
- Researcher-Friendly
Interface - Downloadable result tables (.csv) and editable figures (.svg) for easy utilization in further analyses
- Researcher-Friendly
- Data Quality
Control - Data
Exploration - Protein
Expression - Downstream
Analysis
- Instantly verify experimental and data quality with visualized QC results for each analysis stage.
- Explore data characteristics quickly with analytical summaries.
- View expression levels of proteins of interest.
- Easily explore differential expression and related pathways through an intuitive interface.